Saturday, July 30, 2011

DILE tutorial, part 5: Thread and Call Stack Panel

As I promised in the last entry, this time I'll explain why DILE has to load assemblies to make debugging work. But first a little history. When I started to write DILE I didn't know much about the Unmanaged Metadata API or the debugger API. In fact, I started DILE because I wanted to learn about these. Therefore during the development of the "disassembler" part I really didn't think of how debugging will work. But in the end I found out that I was quite lucky...

Using the Unmanaged Metadata API a lot of information can be read from assemblies similarly to Reflection. Each of these items (methods, types, properties, events, etc.) are identified by tokens which are 4 byte integers. And the debugger API is using these tokens as well. For example, the debugger API will just tell the type definition token of variables but then its the debugger's responsibility to find the matching metadata and make sense of it. If the debugger wants to ask the debugger API to evaluate a field for example, then again the debugger must give the field's token to the API. And luckily, I have all this information since I disassemble loaded assemblies anyway.

Hopefully this explains why you can't evaluate objects which reside in assemblies that are not loaded in DILE or why the call-stack is not complete until all necessary assemblies are loaded.

Obviously, Visual Studio needs such metadata information as well. And during debugging you can even see how VS is loading assemblies and analyzing them. One nice touch in DILE though is that loading all assemblies is not required. Of course, you can do it by enabling the "Warn if the debuggee loads an assembly which is not added to the DILE project?" option. But I prefer disabling this option and rather loading assemblies during debugging whenever I need them. DILE makes this quite easy by displaying an error message when an assembly is missing. In such cases usually you can just right-click the error message and choose "Add module to project" from the context menu to load the required assembly.

Back to the tutorial. I'll explain two panels this time. The first is the thread panel.


This panel simply lists all managed threads in the debuggee process. The active thread can be changed by double-clicking on the thread or by right-clicking and choosing "Change current thread" from the context-menu. In both cases the selected thread's state will be reflected in the UI which means that the thread's call stack, variables, arguments, etc. will be displayed (much like in Visual Studio).

And if you see a "<definition of the Thread class is not loaded>" message in the Name column then don't forget to load mscorlib.dll. This error message means that DILE was not able to retrieve the name of the thread because the necessary mscorlib assembly is not added to the project. The reason is explained above.

The second panel is more interesting. This is the Modules Panel.


It shows a list of all assemblies/modules loaded by the debuggee process. This panel allows loading assemblies by double-clicking them or right-clicking and selecting "Add module to the project" from the context menu.

If the debuggee loads assemblies from byte arrays or creates them on-the-fly (using Reflection.Emit or XSLT transformation or compiled regular expressions and so on) then those will be listed here as well. Assemblies which exist only in memory can be loaded as well just like any other assembly. In this case DILE will do something very nasty: it will load the assembly from the debuggee process by directly reading its memory. Such assemblies can be used just like any other assemblies otherwise: they can be disassembled, debugged, you can put breakpoints in their methods, etc. However, there is one small difference: when the debuggee stops running then in-memory assemblies will disappear from the DILE project as well since these exist only while the debuggee is alive and running.

Labels: ,

Saturday, June 04, 2011

DILE tutorial, part 4: Information, Debug Output and Log Message Panel

The time has come to start to talk about debugging a little bit.

In the bottom of the main window of DILE several panels can be found. The leftmost panel is the Information Panel.
Basically DILE uses this panel for logging. You will see several lines here when an assembly is loaded and you can see error messages here as well if something went wrong. It's worth taking a look at this panel every once in a while especially if something unexpected happens.

The second panel which is called Debug Output Panel is lot more exciting.
I don't want to go into too much detail but roughly debugging works the following way. The Debugger API defines a set of interfaces (like ICorDebugManagedCallback) that debuggers have to implement. When debugging starts debuggers have to create an instance of their own implementation and give that to the Debugger API. Later during the debugging process the API will call methods on this object and this is communication between the API and the debugger is solved.

In the Debug Output Panel DILE displays what calls it receives from the underlying Debugger API exactly. So here you can see messages corresponding to the different events like an assembly was loaded, a code step command was completed or a thread was created. When an event is clicked in the left-side then all corresponding details will be displayed in the right-side of the panel.
This panel is not the most useful one but it can definitely be interesting. :-)

The third panel will be familiar I think. This is the place where debug messages sent by debugge processes are displayed.

That's it for now. Next time I'll continue explaining the remaining panels and the reason why DILE needs so many loaded assemblies for debugging.

Labels: ,

Monday, May 09, 2011

DILE tutorial, part 3: Quick Search and Start Page

This time I'll talk about 2 different parts of the UI. The first one is the Quick Search panel. This panel can be found next to the Project Explorer and it helps with searching for different kind of disassembled items. Let's use the Dile.exe and Dile.Debug.dll files once again for this tutorial.

The idea is not new. There is a text box in the top of the panel where full or partial name of items can be entered and DILE will list all disassembled objects that match the entered text. The searching algorithm is quite simple as it just simply looks for items where the name contains the entered text (so regular expressions are not supported although if somebody really needs it...). Names are case-sensitive so make sure you write your search term with proper casing. Searching is done on a separate thread so it can be stopped anytime by pressing the Escape key. Matched items will appear continuously as this searching thread finds them.

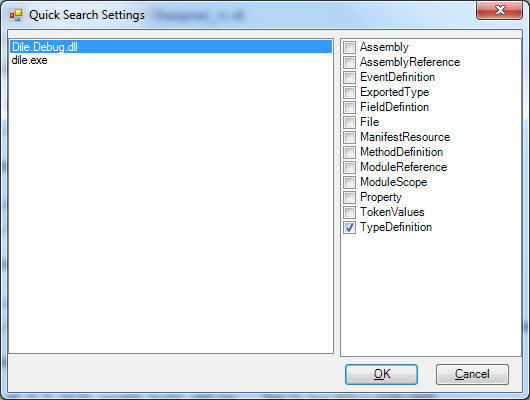
By default only Type Definitions will be displayed but this can be easily changed by clicking on the "..." button next to the text box which will bring up the following window:

Here the searched members can be configured differently for all assemblies. Usually searching for Method Definitions and Properties can be quite useful.

Obviously, searching for items wouldn't be very useful if we couldn't open them. So just right-click on any found item and the following context menu will be displayed:

These are the options:
  • Display item: the disassembled code of the selected item will be displayed in a text panel on the left side.
  • Locate in Project Explorer: the Project Explorer will be brought forward and the selected item will be shown in it. All necessary parent nodes will be expanded to be able to navigate to the item.
  • Copy to clipboard: the name, type or both of the selected item will be copied to the clipboard.
  • Display text...: the name, type or both of the selected item will be displayed in the Text Viewer window.
The Quick Search tool can be really handy when assemblies contain lots of items and navigating the Project Explorer becomes a bit confusing. So spend some time on learning how to use it, it can save lot of time for you in the future. :-)

The second part of the UI that I wanted to talk about is the Start Page. This is the panel that occupies most of the window when DILE starts.
I'm sure this will be familiar as well. The page contains 6 sections:

  • Recent Projects: by default, the last 10 DILE projects that were opened are listed here.
  • Recent Assemblies: by default, the last 10 assemblies that were opened are listed here.
  • Recent Memory Dump Files: by default, the last 10 memory dump files that were opened are listed here.
  • Project News: SourceForge RSS feed that contains news about the DILE project (rarely updated).
  • Latest Releases: SourceForge RSS feed about the latest DILE releases. You can check here whether there is any new version that can be downloaded.
  • Blog: RSS feed of this blog.
For the last 3 sections (RSS feeds) DILE simply sends web requests to get the content of the RSS feeds, then formats the retrieved XML using XSLT and displays them in 3 separate web controls. This is a quite simple and easy solution however it has a few problems. The smaller problem is that since web controls are used they allow you to navigate to other pages within DILE which is quite weird. But the bigger problem is that web controls don't really support drag&drop operations. The best I could achieve is hijacking the drop operation and getting 1 file name from the list of dropped files. Therefore if you want to open more than one assemblies by dropping them on DILE then please try to avoid the web control areas. I think in the future I'll replace these web controls with custom controls just to solve this drag&drop issue.

Ok, that's all for now. I hope I've managed to tell a few tricks again. :-)

Labels: ,

Sunday, May 01, 2011

DILE tutorial, part 2: Project Explorer

Let's start to dissect the UI of DILE. One of the most important parts is definitely the Project Explorer. This is the place where all loaded assemblies can be viewed and their contents can be browsed.

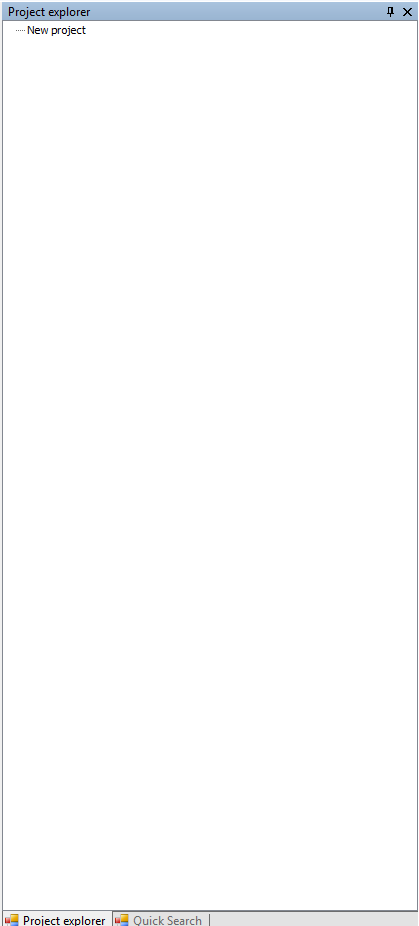
When DILE is started it creates a new, empty project automatically. Therefore the Project Explorer is empty first:

Right-click on the "New project" node and a simple context menu will be displayed:

The options are:
  • Add assembly...: This option will open the usual Windows Open File Dialog where one or more assemblies can be selected. Obviously, DILE will load all the selected assemblies and their content will be displayed in the Project Explorer (see later).
  • Reload all assemblies: DILE does not hold lock on any loaded assembly therefore it's safe to add the output assembly of your Visual Studio project. Whenever you make changes and recompile your assembly, just choose this option to reload all the assemblies which are in the Project Explorer so DILE can pick up the latest version. However, reloading assemblies will not affect currently displayed IL code. This is both kind of a bug and feature. I thought about fixing it but in some cases I found it useful that I could compare the old and new version of the IL code of an element.
  • Properties...: This option opens the project properties windows. I'll explain that window in a later post.
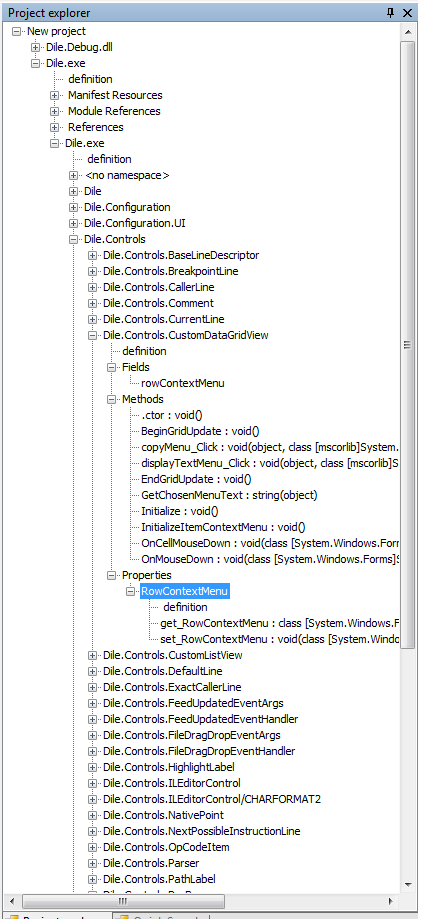
Ok, so once we load an assembly, it appears in the Project Explorer. Just for fun, let's load Dile.exe and Dile.Debug.dll:
I'm sure this view is familiar from other decompilers and disassemblers. You can see all loaded assemblies and their content in a nice tree view. There are special nodes with the name "definition" which allow you to open the definition of the parent node. So for example, the first "definition" node in the screenshot above can be used to open the assembly definition. While the second is for opening the definition of the module. Roughly, the tree structure is something like this:
  • Project
    • Assembly
      • Exported Types: types that are forwarded using the TypeForwardedTo attribute.
      • Manifest Resources
      • Module References: unmanaged module references.
      • References: assembly references.
      • Files: referenced files
      • Namespaces: all namespaces of the assembly are listed here. Often, there is a special namespace called: <no namespace>. In some cases compilers generate classes without any namespace and all those classes will be listed here.
        • Types: all types that belong to the parent namespace will be listed here.
          • Events: events of the type, if there are any.
            • Add/remove methods of the parent event.
          • Fields: fields of the type, if there are any.
          • Methods: methods of the type, if there are any.
          • Properties: properties of the type, if there are any.
            • Get/set/let/other methods of the parent property.
In general, leaf nodes can be double-clicked and related disassembled code will be displayed in a text viewer. For example, double clicking the get() method of a property will display the IL code associated with that method.

A few of the nodes also have quite important associated context menus. Right-clicking on an assembly will bring up the following menu:
The options are:
  • Full path of the assembly: Clicking it won't do anything, it's displayed only as information.
  • Copy path to clipboard
  • Display path...: The full path will be displayed in the Text Viewer window. I'll talk about this window later.
  • Set as startup assembly: This option marks the assembly as the startup assembly and enables debugging. Startup assemblies are marked with a red color and italic font-style. I'll explain debugging in another blog post, it's quite a big subject.
  • Reload assembly: This option allows reloading only the selected assembly.
  • Remove assembly: Removes the assembly from the project (and the Project Explorer as well, of course).
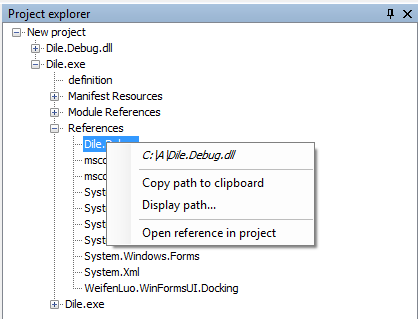
A special context menu is available for assembly references as well:
Options:
  • Full path of the referenced assembly: The full path is determined during assembly loading and not during debugging therefore the path might be incorrect (for example, an AppDomain.AssemblyResolve event handler can easily return a different assembly during runtime). Again, clicking this option does not do anything.
  • Copy path to clipboard
  • Display path...: Displays the full path of the referenced assembly in the Text Viewer window.
  • Open reference in project: Loads the referenced assembly using the determined full path and adds it to the project (and thus to the Project Explorer).
I think that's all I can tell about the Project Explorer. Hopefully I have managed to show a few new options and/or explain how some of them really work. If you have any questions, just let me know. :-)

Labels: ,

Friday, April 22, 2011

Time to kill DILE?

First of all, please take a look at this post:
ILSpy Debugger Preview

I think ILSpy is one of the most promising free alternatives of Reflector. I'm already using and like it. However, as the post above shows it also supports debugging... which makes DILE quite useless, to be honest. Of course, it's not as feature rich as DILE yet but I'm quite sure the #develop team will soon match DILE's capabilities since they just have to integrate the existing debugger engine of #develop into ILSpy and they are done. And they have even managed to tie their debugger and decompiler together which means that ILSpy is able to debug the decompiled C# code, not just the IL code. Which is a really amazing feature. No doubt, soon it'll be a lot more useful tool than DILE.

Which makes me wonder whether it's worth continuing DILE. I started this project more than 6 years ago and it always surprised me that during all these years nobody created any similar product (or at least I don't know of any). For a while it seemed like Microsoft's mdbg might be a similar tool but lately it seems to be neglected.

Anyway, I've spent lots of nights on developing DILE. Lately I could spend less time on it though as before. I have a full-time job, a wife and a 2.5 years old son which should explain this. For the last 2 years I stayed awake until 4 am almost every Friday and Saturday just to do my usual stuff (reading blogs etc.) and work on DILE. I'm also writing this post at 3 am... So, I have really sacrificed a lot for the DILE project. Please don't misunderstand me though, I don't regret it at all. I would say it was well worth it as I learnt a lot along the way and it even helped me to find better jobs (it looks good in my CV :-)).

So this is the current situation. I think I have a couple of choices:
1. Keep working on DILE and make it an alternative of ILSpy
I think it's safe to say that right now DILE is a better debugger than ILSpy. However, there is whole team behind ILSpy and I definitely can't compete with them alone. Oh, and I'm sorry but actually I do want to work on DILE alone. Simply because I want to know all its parts to learn a little bit about everything. So, once ILSpy has all the usual debugger features I simply can't see why anyone would choose DILE. Maybe I could start to work on the assembler part like I have been planning for a long time and that would make DILE a unique tool once again but I'm sure it wouldn't be such a big trouble for the #develop team to do the same. So, I'm really not sure whether it's worth it.

2. Rewrite DILE and ignore ILSpy
Seriously, I think the code of DILE is just awful. I'm ashamed of it. I've been dreaming of rewriting it for ages but never really dared to do it because it would take probably a year or more to do so especially at my current pace. But now that ILSpy appeared, I don't have much to lose. I could rewrite DILE from scratch, create a proper disassembler API, clean-up all the debugging code, maybe create a nice plug-in system and so on. It would be fun. At the end I still wouldn't be able to compete ILSpy but at least I would have some fun.

3. Just give it up
Maybe I should do this. And spend my nights in the bed, not in front of the computer.

I really don't know which option I should choose...

Anyway, even before I read about the debugger feature of ILSpy I was planning to write a little tutorial for DILE and I will really do that in the next couple of weeks. Meanwhile I'll try to decide what to do with DILE.

Soon it's time to go to sleep. It's almost 4 am...

Labels: ,

Sunday, March 13, 2011

No more BadImageFormatExceptions

Hopefully.

As far as I can tell, one of the most common errors that users encounter with DILE is that it crashes on startup with a default Windows error message box. Usually an entry is generated in the Event Log though that says an unhandled BadImageFormatException caused the problem.

Most often the reason for this error is that the Microsoft Visual C++ Runtime is not installed on the machine and therefore the Dile.Debug.dll (which is a VC++ assembly) cannot be loaded. Obviously, installing the runtime solves this problem.

However, there's one more solution: copying the necessary runtime files in the folder of the application. This way installation of the runtime can be avoided.

So, to avoid such ugly BadImageFormatExceptions in the future, I'll include the necessary files (mvcp100.dll and msvcr100.dll) in all new releases of DILE. This means each release will be ~0.5 MB bigger but hopefully this step will save a lot of headache for new users. And DILE will still fit on a 3.5" floppy disk. :-)

Of course, if you don't want to have those extra dlls in the DILE folder then you can delete them and rather install the VC++ runtime.

Labels:

Sunday, August 22, 2010

DILE feature: loading modules from memory dump files

One of the main reasons why I started to work on dump-debugging support for DILE is that I thought I could add a little twist to it once again.

The problem
If you're using VS2010 for analyzing a dump file then you'll run into a quite serious problem very quickly: if VS can't find the original source code and pdb file of the modules then it will show you only the disassembled x86 code. This can really make life difficult as it's quite difficult to map back those x86 instructions to your actual code to figure out which line caused a problem etc.

The solution
DILE has had a very interesting feature for ages: it can load dynamically generated assemblies from the memory of a debuggee process. What this means is that if your application generates assemblies on-the-fly via Reflection.Emit (compiled RegExes do the same or the XSLT compiler if an XSLT file contains C# code) then DILE can load that assembly and treat it as any other assembly even if it's never saved on the hard disk. And of course, all the usual features like breakpoints, stepping etc also work with such dynamic assemblies.
So obviously I wanted to do the same with dump files since they usually contain the full memory of the debuggee, including loaded modules. Fortunately it was quite easy to modify the code to load modules from the memory of the debuggee process (i.e. from the dump file) instead of looking for them on the hard disk. Although fixing the UI wasn't trivial but that's a long story. :-)

Usage
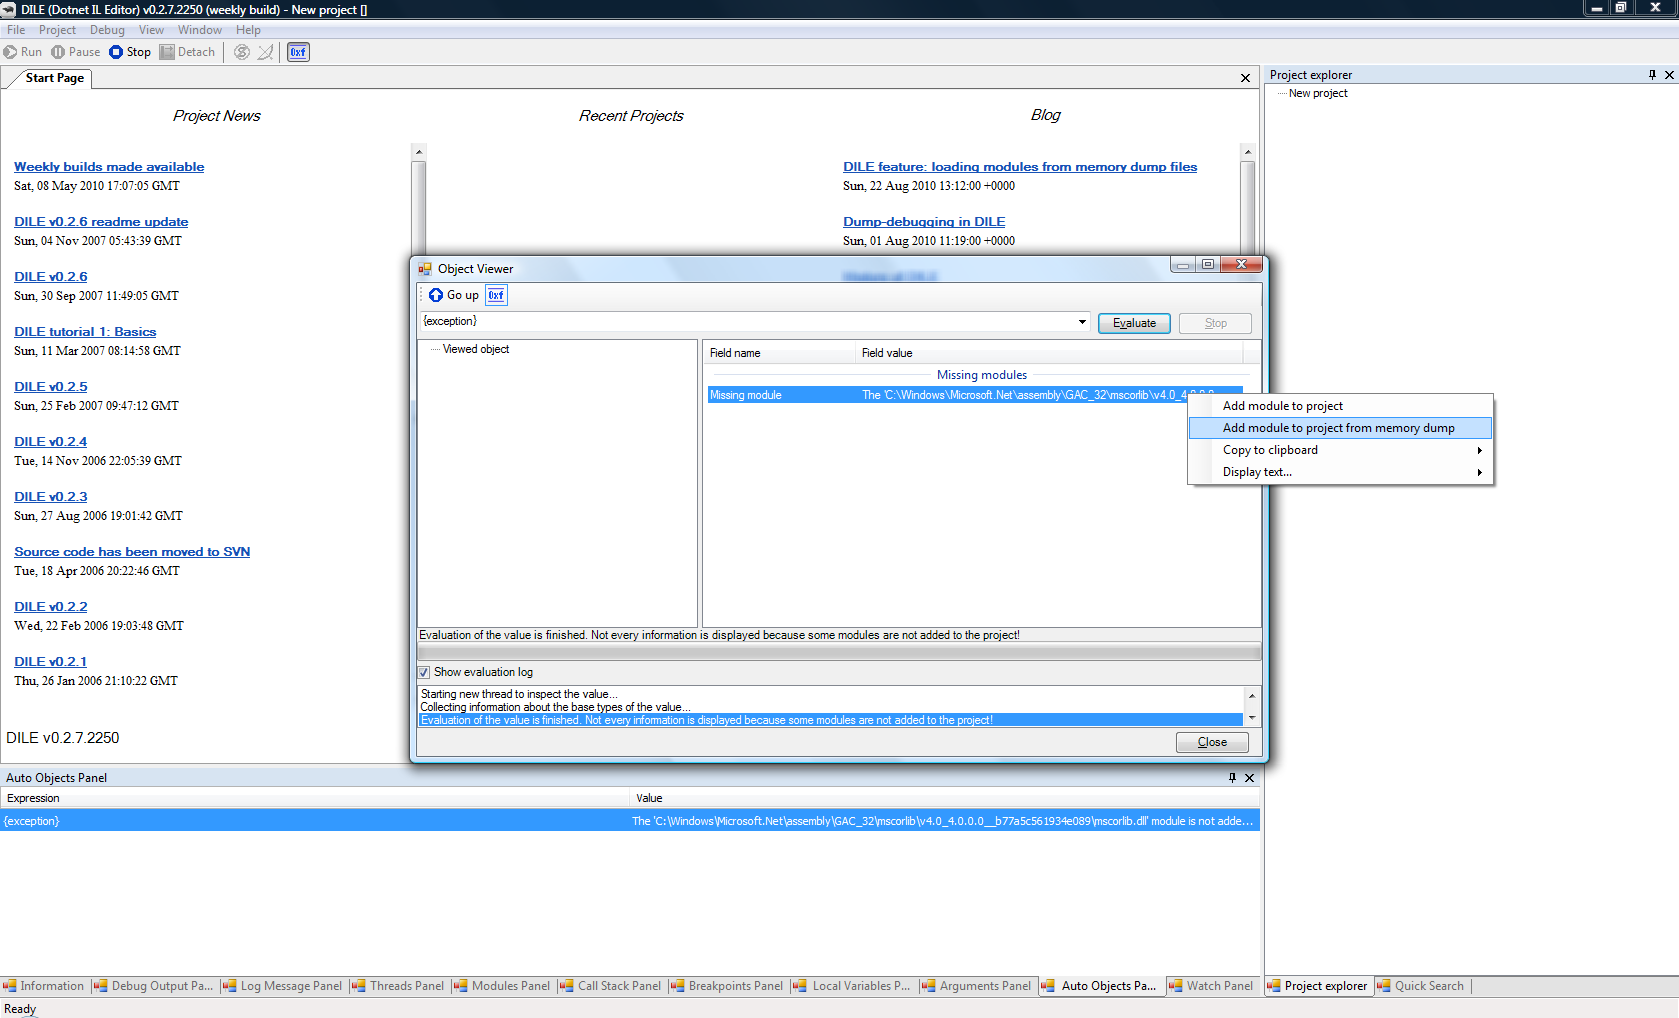
If you download the latest weekly build of DILE and load a dump file in it then you will notice that there's a new menu item in all context menus related to modules: "Add module to project from memory dump". If you click on this option then DILE will read the module from the dump file and not from your local hard drive.

Why is this cool?
As a result you don't have to worry anymore about what version of your application crashed when you created the dump file, you don't have to know what patches were applied on your application/3rd party components/.NET Framework and most importantly you don't have to have exactly the same version of all components on your machine when you're dump debugging. DILE will show you the state of your application _exactly_ as it was when the dump file was created. And that makes finding bugs a lot easier. :-)

Update:
The Screenshots
Alex suggested in the comments section adding screenshots to this post which is definitely a good idea. I used to upload files to FreeWebTown but let's say... I'm not really satisfied with them. They simply deleted my account without any warning so all the files that I had there are lost. Unfortunately I don't have backups as well because over the years I had a few unplanned hard disk crashes etc.
Anyway... I've realized that I can also upload files to SourceForge. I trust them more. :-)
So, the screenshots:


Opening a memory dump file

Loading module from the memory dump file in the Modules Panel


Loading module from the memory dump file in the Call Stack Panel

Loading module from the memory dump file in the Object Viewer

Labels: , ,

Sunday, August 01, 2010

Dump-debugging in DILE

I have spent the last few weeks on trying to get dump debugging working in DILE. At last, I have something that is working quite well. However, I have to warn everyone who wants to try the latest weekly build: I had to modify quite a lot of things (especially in the UI) and as a result I might have broken features that affect "live" debugging as well. So, I strongly recommend using the latest build really only for experimenting.

Enough of excuses. Here is what you get if you give the latest version a try.

Save memory dump
If you click on the File menu then you will see that there's a new item called "Save memory dump". This feature allows you to dump the memory of any (managed or unmanaged) process. Under the hood it's really just a call to a Win32 function to create the memory dump file.
Usage:
1. Click File -> Save memory dump...
2. Enter the Id of the target process or select it using the Browse... button.
3. Select a dump type. You can find detailed description of what these flags mean in MSDN. In most cases, leaving the default selection is perfectly fine.
4. Select the location where the memory dump file will be saved.
5. Click Save. You're done.

Rules:
- You can dump the memory of both managed and unmanaged processes.
- The target process doesn't have to be paused or being debugged. (although taking a memory dump of a process that is running doesn't sound very useful)
- The result memory dump file is completely standard. You can load it in VS2010, WinDbg, DILE or any other debugger.

Load memory dump
This is the really interesting bit. Once you have a dump file, you can copy it to any machine, load it in DILE and check the status of the target process as it was when you made the dump. DILE is using the same API as VS2010 so you get the same features (more or less).
Usage:
1. Click File -> Load memory dump...
2. Select your dump file and click Open.
3. At this point DILE switches into a state that is very similar to what you get when you pause a live process.

Rules:
- Only .NET 4.0 target processes are supported.
- You can see threads, modules, call stack, local variables, arguments and current exception. You can inspect variables using the Object Viewer, switch between threads and frames in the call stack and so on. So you get all the usual features.
- Obviously, you can't step in the code or run the process as there's no live process.
- For now, assemblies are loaded from your hard disk and not from the memory dump. Therefore if an assembly is not exactly at the same location as it was on the original computer then you will have to help DILE and load it manually. (I'll try to fix this later.)
- Unfortunately you can't evaluate method calls.

The latter is quite a serious limitation and I know VS2010 supports it. I think, VS uses a so called "IL interpreter" but I couldn't find any information about it. I'm afraid it's not a proper public API but rather a feature in VS2010 that is not exposed to anyone else. I've already asked about it in an MS forum and currently my question is assigned to Jon Langdon (PM of the debugger team) but I haven't received any reply yet. So, please vote on my thread, perhaps it will help me to get an answer faster. :)

Anyway, that's what I have for now. Have fun with DILE and dump-debugging. And as always, please let me know if you find any bug related to memory dump or live debugging. Or anything else. :)

Labels: ,

Sunday, May 30, 2010

DILE and .NET 4.0

Good news. I've started to work on modifying DILE to support .NET 4.0. The latest weekly build that I uploaded is running on .NET 4 and it does support debugging .NET 4 applications. However, it doesn't really use any .NET 4 specific feature yet and so far I've tested it for maybe half an hour so be very cautious with it. :-)

By the way, upgrading to .NET 4 was not so trivial. Apparently the MSDN documentation is not really clear about how it should be done. But fortunately Rick Byers helped me after I posted my question in an MSDN forum. So, I owe him a special thanks and hopefully his answer will help others as well.

P.S.: I think I will try to add support for debugging dump files as well in the future. :-)

Labels: ,

Saturday, May 08, 2010

(Almost) Weekly builds

Usually after working on DILE, I make a release build which I upload to SkyDrive for myself. The next day I download it in my office and use it. "Eat your own dogfood.". And I was thinking that others might also be interested in getting such latest builds of DILE. Fortunately my suspicion was confirmed by an e-mail that I received not so long ago. Thus I decided to make weekly builds of DILE publicly available.

First of all a warning: what I upload and make available is _never_ a stable, tested version of DILE. It might crash and cause other problems. I don't promise that it works properly. It is a version that is still under development, features might not be completely implemented and there might be bugs that officially released versions should not have. I strongly recommend using v0.2.6 that is available on SourceForge for doing serious job like debugging on a production server.

But if you're still interested in using the latest version of DILE despite the warning then you can find the build on SourceForge. I will regularly update this file based on the latest modifications in the source code.

I really hope that sharing the latest build of DILE will help me with getting more feedback. Therefore if you have any opinion about the changes that you see in DILE or you find any bug that I introduced since the last official release then please let me know.

Edit: I modified the link to the weekly builds. I will always put the latest weekly build in the DILE/WeeklyBuild folder together with a couple of previous versions.

Labels: ,

Monday, April 05, 2010

DILE logo

One of my colleagues complained several times because DILE used the standard .NET icon and thus it was a bit difficult to find it in the taskbar.

Unfortunately I can't draw. I have absolutely no talent for arts so I decided to look for a logo. And what else could the logo be? Of course, it's a crocoDILE (pun intended).

However, finding logos is not as easy I thought. I spent more than 3 hours on searching for images on the Internet. I wanted something free, non-cartoonish with the correct aspect ratio. In the end I found this:


It's quite nice I think. I've created smaller icons from it and now both the .exe and the main form uses these icons. I've also added a Start Page which contains this logo and the version number.


I'm also going to add the list of recent projects and assemblies to this new Start Page which will make it a bit more useful.

But seems like I'm not done with images yet as another colleague keeps asking me to find icons for the panels...

Labels: ,

Sunday, March 14, 2010

I'm back

Well, I've never really left.

For the last few years I have been quite busy (or rather lazy) so I didn't spend too much time on my blog or DILE. Although I was always "here", answered e-mails and fixed bugs in the code. By the way, one of the reasons why I "disappeared" is that my son was born in 2008 and he keeps me quite busy since then (although I really enjoy it :-) ).

Quite surprisingly - despite my inactivity - DILE has remained quite popular. According to SourceForge it is still downloaded 4-500 times/month which makes me really happy.

And actually it's becoming popular even among my colleagues. So I decided to continue working on DILE. I really hope that I can finish it before MS comes up with a new platform (.NET is becoming rather old as its first beta was released a decade ago).

So dear reader/DILE user, as a first step, I'd like to ask your help in making DILE a bit more bug-free. Unfortunately there are still many bugs in DILE (in fact, I've just fixed 2 bugs in the debugging-time expression evaluation code) and thus if you come across any then please submit it in SourceForge and I'll try to fix it as soon as possible.

Although I can't promise spending as much time on DILE as I used to but I'm trying to do my best. I spend weekdays with my son and try to work on DILE in the weekends after he goes to sleep. Actually, I sleep more during weekdays than weekends (yesterday I was fixing those 2 bugs until 4 a.m. :-) ).

Thank you in advance and happy DILE-ing! :-)

P.S.: Expect a few more blog entries in the near future about DILE. :-)
P. P.S.: Unfortunately spammers have found my blog so I decided to manually moderate comments. But please feel free to send comments; I'll publish them as long as they are DILE related.

Labels: ,

Sunday, November 04, 2007

DILE v0.2.6: VC++ SP1 runtime

A few days ago I tried to run DILE on a Windows XP machine which had only .NET Framework installed. Of course, I got the usual System.IO.FileLoadException. So, I installed the VC++ runtime which is needed because the Dile.Debug.dll is actually a mixed assembly. However, this didn't solve the problem. After searching a little bit on google I noticed that there is a new VC++ runtime which was published together with the Visual Studio SP1. Since I am using Vista, I also installed the SP1 and as a result the Dile.Debug.dll references the new SP1 runtime.

So, please install the VC++ SP1 runtime if you want to use DILE v0.2.6 on a machine which doesn't have Visual Studio SP1 and/or the VC++ components installed.

I have updated the .zip files on Sourceforge (I only changed the readme.txt, nothing else) and fixed the readme.txt to contain the correct links.
So, here is the updated readme.txt file separately, plus the links to the correct runtimes:
x86 VC++ SP1 runtime
x64 VC++ SP1 runtime

Of course, if you have already downloaded DILE v0.2.6, then it is not necessary to download it again, just remember to use the new runtime if you ever receive a FileLoadException.

Labels:

Saturday, September 29, 2007

DILE v0.2.6

I have uploaded a new version of DILE on to Sourceforge.

zip file (x86): dile_v0_2_6_x86.zip
zip file (x64): dile_v0_2_6_x64.zip
readme.txt: readme.txt
license.txt: license.txt
change_log.txt: change_log.txt

There are four main improvements besides several small ones and bug fixes (see the change_log.txt for more details):
  • Generics (type parameters) are now completely supported, which means that the Object Viewer window can inspect and display such types perfectly and expressions that contain type parameters can be evaluated during debugging as well.
  • .NET 2.0 permission sets are now displayed correctly. Earlier I could not find the specification of these; and thus I just displayed the binary content which often resulted in ugly unicode characters. Eventually, I could find the specification and this problem is fixed now.
  • Events are disassembled. This was my mistake, I simply forgot about events... In the Project Explorer the tree now contains an "Events" node where a class' events are collected.
  • Enums are also parsed now and can be used in expressions. However, my implementation differs from Visual Studio's. Mine is not so strict, which means that enum values don't have to be converted to int or their other underlying type. E.g.: TestApplication.TestClass.TestMethod(TestApplication.TestEnum.TestField) is accepted by DILE, it's not necessary to cast the TestApplication.TestEnum.TestFiled to int.


Proper .NET 2.0 permission set (instead of the ugly unicode characters)

Event of a class

New generic instance created by evaluating expression

Calling instance method with type parameter on a generic object

Array of generic objects

Array of generic structs

Calling a method that has its own type parameters but also uses its enclosing generic class's type parameter as well

Passing enum as parameter (instead of int value as earlier)


Here are some of the expressions that I used for testing. These are correctly evaluated by the new version:
TestApplication.GenericClass.Method()
new TestApplication.GenericsTest(5, "test")
new TestApplication.GenericsTest2().GenericMethod(5)
new TestApplication.GenericsTest(5, "test").GenericMethod(6)
new TestApplication.TestClass.NestedClass()
new TestApplication.GenericClass.NestedGenericClass()
new TestApplication.TestClass.NestedClass[] {new TestApplication.TestClass.NestedClass()}
new TestApplication.TestClass[] {new TestApplication.TestClass(1, "one")}
new System.DateTime[] {System.DateTime.Now}
new TestApplication.GenericStruct[] {new TestApplication.GenericStruct(1, "one")}
TestApplication.GenericClass.StaticMethod("test")
TestApplication.GenericClass.NestedGenericClass.StaticGenericMethod("test")
TestApplication.GenericClass.NestedGenericClass.StaticMixedMethod(System.DateTime.Now, 5, null)
new TestApplication.DebugTest.InnerClass[] {new TestApplication.DebugTest.InnerClass(), null}
TestApplication.TestClass.TestMethod(TestApplication.TestEnum.TestField)
new TestApplication.GenericClass(TestApplication.EnumClass.TestField)
System.Text.Encoding.UTF8.GetString(V_0) (V_0 is a byte array)

P.S.: According to SourceForge DILE has been downloaded more than 10,000 times! Wow! Thank you! :-)

Labels:

Wednesday, March 07, 2007

DILE tutorial: basics

Link to the tutorial (3.8 MB!)

Finally, I have finished the first tutorial for DILE. It just shows some basic features of DILE and should be enough to get you started with it.
Basically, the animation shows how to debug a newly created, very simple application (which just adds two numbers). It demonstrates how to start the application in DILE, how to step through the code, check the call stack, loaded modules, local variables/arguments, evaluate expressions and how to use the Object Viewer. There are lots of explaining messages that will - hopefully - make clear why some things work differently in DILE.

Please, let me know of what you think of this tutorial, whether it's really useful, whether I should make more and if yes, then I'd be glad to hear ideas on what should the following ones be about (I have a few more subjects on my mind though). Of course, I'd also like to hear if you think that I should do something differently in such tutorials. And - as always - if you have anything else to say about DILE then just send me an e-mail or leave a comment. :-)

One more thing, if you are planning to link to the tutorial (why would anyone do that though?), then please link to this blog entry. Sooner or later (but rather later...) I will create a homepage for DILE and then I will move the tutorials there also and I'll update the link to it in this post. Thanks!

P.S.: As Sebastian suggested, I have used Wink for creating this Flash animation.

Labels: ,

Saturday, March 03, 2007

Windows Developer Power Tools

At last, I have the time to mention in this blog that THE book has been released. Actually, it was released last year. Here is a picture of the author holding a copy of it and actually, today I have received my copy of it as well (thanks O'Reilly). It's really great feeling to see my name and my tool in a book. :-)

No doubt, the two authors (Jim Holmes and James Avery) are doing everything to make the book more popular. Last month was the Windows Developer Power Tools Day, a podcast has been created by WebDevRadio and an interview with the authors has even been uploaded to Channel 9.
Oh, and don't forget the book's website, where DILE has its own page as well. Btw, you're welcome to vote on it. ;-)

I really hope that book will be/is popular and useful. And perhaps DILE can also get some new users from it. :-)

Labels: ,

Sunday, February 25, 2007

DILE v0.2.5 (64-bit compatible)

First of all, yep, I'm still alive. Lately I have been quite busy, I had quite a lot of things to arrange after moving to Singapore. Finding a proper accomodation was also not easy. But - at last - things seem to settle down and hopefully soon I can get back to my normal life and spend more time on DILE also. :-)

Second, I could not stand the overwhelming demand anymore... Lots of users (means 2) have informed me that DILE is not running on x64 OS. I had a few ideas what can be wrong but in the end I found out that the problem was more serious than I expected. Basically, I made 2 big mistakes:
1. I mixed up IntPtr and uint/int variables in some cases. On x86 processors this didn't cause problem because both are 4-byte data type, but of course on x64 it immedately caused an exception.
2. I didn't know (shame on me) that 64 bit assemblies have different headers. x86 files have PE32 and 64 bit assemblies have PE32+ header. The difference between the two is little, but enough to make my positioning algorithm fail.

The good news is that I have fixed both problems and now DILE is working correctly on x64 OS also. Actually, I have tested it on Windows Server 2003 x64.
There are no other improvements for now though, only a few more bug fixes (see change log).

zip file (x86): dile_v0_2_5_x86.zip
zip file (x64): dile_v0_2_5_x64.zip
readme.txt: readme.txt
license.txt: license.txt
change_log.txt: change_log.txt

Just a few screenshots to keep this old habit + prove that DILE is really x64 compatible:

Disassembled 64-bit assembly

Debugging DILE with DILE on x64 OS


One note: the DockPanelSuite seems to have some problem with x64. Panels look weird for me. But I think it's not a DILE bug. Actually, the second screenshot shows that the DockPanelSuite throws an ArgumentOutOfRangeException.

Next step: making Flash tutorials for DILE...

Labels: ,

Tuesday, November 14, 2006

DILE v0.2.4

Here is the 0.2.4 version of DILE, as I promised earlier. I really hope that it's lot more stable and easier to use now...
As always, the important files first:

zip file: dile_v0_2_4.zip
readme.txt: readme.txt
license.txt: license.txt
change_log.txt: change_log.txt

No doubt, there are two very important improvements: the new Object Viewer window and having context menus almost everywhere. Both of these increase the usability of DILE a lot.
But here are some other improvements in detail (check the change log for a full list):
  • completely rewritten (from "scratch") the Object Viewer form, now it's multi-thread, lot more reliable, it has log functionality, evaluations can be aborted and displayed information is lot more complete (no fields or properties should be missing)
  • changed the structure of displayed nodes in the Project Explorer: types are grouped by namespaces (hopefully this improves usability)
  • redesigned the Quick Search Settings form
  • several panels (modules, threads, local variables, arguments, watch, auto objects, callstack) use lazy-initialization to display information which means that they refresh their contents only when they're visible
  • made evaluation aborting more robust and reliable
  • added set IP (instruction pointer, basically it's like the Set next statement in VS)
  • added Watch Panel (every expression that is added to the panel will be evaluated after each step)
  • added a text displayer form that can be used to display text with or without escape characters, format text as xml or display text as html
  • added context menu to every ListView and DataGrid control; the menu allows you to copy values to clipboard or display them in the text displayer form, and also contains custom actions when available
  • fixed bug: breakpoints were not set in assemblies which had different assembly and module name (e.g.: mscorlib)


And screenshots of the new features:

The new Object Viewer window

Text displayer window

The new context menu

"Set IP" to instruction feature

"Add module to project" option in the Object Viewer


Don't hesitate to contact me with problems or ideas regarding DILE. :-)

Labels: