DILE tutorial, part 2: Project Explorer
Let's start to dissect the UI of DILE. One of the most important parts is definitely the Project Explorer. This is the place where all loaded assemblies can be viewed and their contents can be browsed.
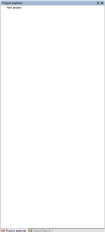
When DILE is started it creates a new, empty project automatically. Therefore the Project Explorer is empty first:
Right-click on the "New project" node and a simple context menu will be displayed:
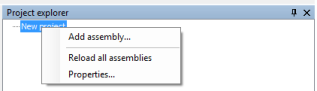
The options are:
When DILE is started it creates a new, empty project automatically. Therefore the Project Explorer is empty first:
Right-click on the "New project" node and a simple context menu will be displayed:

The options are:
- Add assembly...: This option will open the usual Windows Open File Dialog where one or more assemblies can be selected. Obviously, DILE will load all the selected assemblies and their content will be displayed in the Project Explorer (see later).
- Reload all assemblies: DILE does not hold lock on any loaded assembly therefore it's safe to add the output assembly of your Visual Studio project. Whenever you make changes and recompile your assembly, just choose this option to reload all the assemblies which are in the Project Explorer so DILE can pick up the latest version. However, reloading assemblies will not affect currently displayed IL code. This is both kind of a bug and feature. I thought about fixing it but in some cases I found it useful that I could compare the old and new version of the IL code of an element.
- Properties...: This option opens the project properties windows. I'll explain that window in a later post.
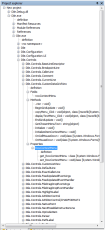
Ok, so once we load an assembly, it appears in the Project Explorer. Just for fun, let's load Dile.exe and Dile.Debug.dll:
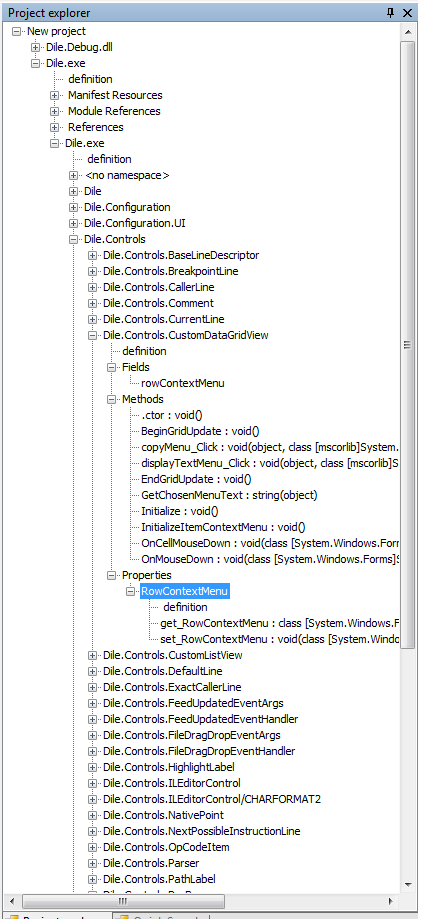
I'm sure this view is familiar from other decompilers and disassemblers. You can see all loaded assemblies and their content in a nice tree view. There are special nodes with the name "definition" which allow you to open the definition of the parent node. So for example, the first "definition" node in the screenshot above can be used to open the assembly definition. While the second is for opening the definition of the module. Roughly, the tree structure is something like this:
- Project
- Assembly
- Exported Types: types that are forwarded using the TypeForwardedTo attribute.
- Manifest Resources
- Module References: unmanaged module references.
- References: assembly references.
- Files: referenced files
- Namespaces: all namespaces of the assembly are listed here. Often, there is a special namespace called: <no namespace>. In some cases compilers generate classes without any namespace and all those classes will be listed here.
- Types: all types that belong to the parent namespace will be listed here.
- Events: events of the type, if there are any.
- Add/remove methods of the parent event.
- Fields: fields of the type, if there are any.
- Methods: methods of the type, if there are any.
- Properties: properties of the type, if there are any.
- Get/set/let/other methods of the parent property.
In general, leaf nodes can be double-clicked and related disassembled code will be displayed in a text viewer. For example, double clicking the get() method of a property will display the IL code associated with that method.
A few of the nodes also have quite important associated context menus. Right-clicking on an assembly will bring up the following menu:
 The options are:

A few of the nodes also have quite important associated context menus. Right-clicking on an assembly will bring up the following menu:

- Full path of the assembly: Clicking it won't do anything, it's displayed only as information.
- Copy path to clipboard
- Display path...: The full path will be displayed in the Text Viewer window. I'll talk about this window later.
- Set as startup assembly: This option marks the assembly as the startup assembly and enables debugging. Startup assemblies are marked with a red color and italic font-style. I'll explain debugging in another blog post, it's quite a big subject.
- Reload assembly: This option allows reloading only the selected assembly.
- Remove assembly: Removes the assembly from the project (and the Project Explorer as well, of course).
A special context menu is available for assembly references as well:
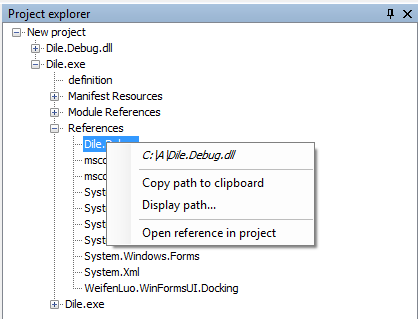
Options:
- Full path of the referenced assembly: The full path is determined during assembly loading and not during debugging therefore the path might be incorrect (for example, an AppDomain.AssemblyResolve event handler can easily return a different assembly during runtime). Again, clicking this option does not do anything.
- Copy path to clipboard
- Display path...: Displays the full path of the referenced assembly in the Text Viewer window.
- Open reference in project: Loads the referenced assembly using the determined full path and adds it to the project (and thus to the Project Explorer).
I think that's all I can tell about the Project Explorer. Hopefully I have managed to show a few new options and/or explain how some of them really work. If you have any questions, just let me know. :-)
posted by Zsozso at 5/01/2011 05:28:00 PM
![]()
![]()


0 Comments:
Post a Comment
<< Home