Saturday, July 30, 2011

DILE tutorial, part 5: Thread and Call Stack Panel

As I promised in the last entry, this time I'll explain why DILE has to load assemblies to make debugging work. But first a little history. When I started to write DILE I didn't know much about the Unmanaged Metadata API or the debugger API. In fact, I started DILE because I wanted to learn about these. Therefore during the development of the "disassembler" part I really didn't think of how debugging will work. But in the end I found out that I was quite lucky...

Using the Unmanaged Metadata API a lot of information can be read from assemblies similarly to Reflection. Each of these items (methods, types, properties, events, etc.) are identified by tokens which are 4 byte integers. And the debugger API is using these tokens as well. For example, the debugger API will just tell the type definition token of variables but then its the debugger's responsibility to find the matching metadata and make sense of it. If the debugger wants to ask the debugger API to evaluate a field for example, then again the debugger must give the field's token to the API. And luckily, I have all this information since I disassemble loaded assemblies anyway.

Hopefully this explains why you can't evaluate objects which reside in assemblies that are not loaded in DILE or why the call-stack is not complete until all necessary assemblies are loaded.

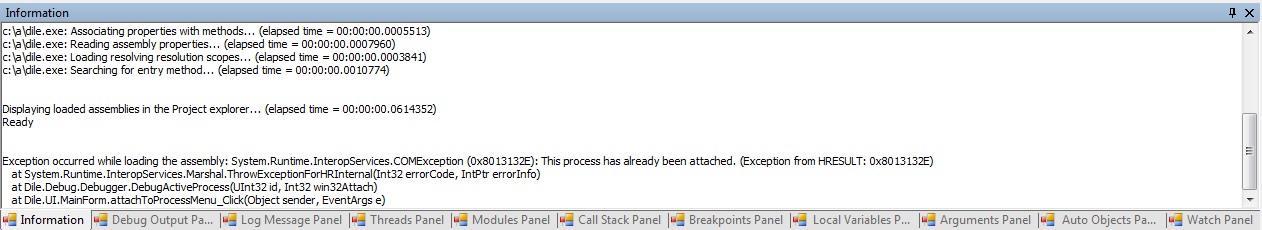
Obviously, Visual Studio needs such metadata information as well. And during debugging you can even see how VS is loading assemblies and analyzing them. One nice touch in DILE though is that loading all assemblies is not required. Of course, you can do it by enabling the "Warn if the debuggee loads an assembly which is not added to the DILE project?" option. But I prefer disabling this option and rather loading assemblies during debugging whenever I need them. DILE makes this quite easy by displaying an error message when an assembly is missing. In such cases usually you can just right-click the error message and choose "Add module to project" from the context menu to load the required assembly.

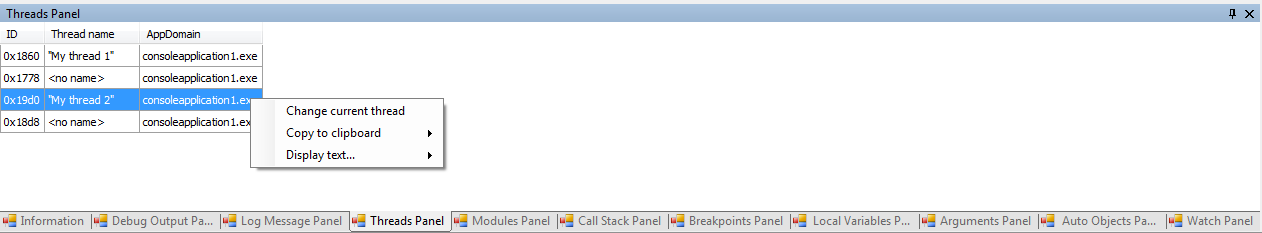
Back to the tutorial. I'll explain two panels this time. The first is the thread panel.


This panel simply lists all managed threads in the debuggee process. The active thread can be changed by double-clicking on the thread or by right-clicking and choosing "Change current thread" from the context-menu. In both cases the selected thread's state will be reflected in the UI which means that the thread's call stack, variables, arguments, etc. will be displayed (much like in Visual Studio).

And if you see a "<definition of the Thread class is not loaded>" message in the Name column then don't forget to load mscorlib.dll. This error message means that DILE was not able to retrieve the name of the thread because the necessary mscorlib assembly is not added to the project. The reason is explained above.

The second panel is more interesting. This is the Modules Panel.


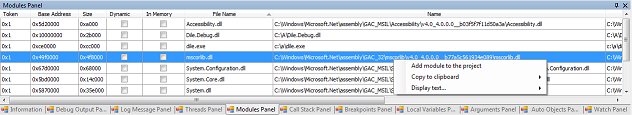
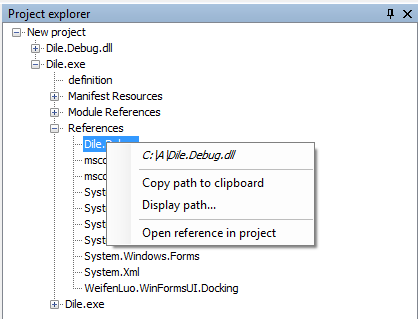
It shows a list of all assemblies/modules loaded by the debuggee process. This panel allows loading assemblies by double-clicking them or right-clicking and selecting "Add module to the project" from the context menu.

If the debuggee loads assemblies from byte arrays or creates them on-the-fly (using Reflection.Emit or XSLT transformation or compiled regular expressions and so on) then those will be listed here as well. Assemblies which exist only in memory can be loaded as well just like any other assembly. In this case DILE will do something very nasty: it will load the assembly from the debuggee process by directly reading its memory. Such assemblies can be used just like any other assemblies otherwise: they can be disassembled, debugged, you can put breakpoints in their methods, etc. However, there is one small difference: when the debuggee stops running then in-memory assemblies will disappear from the DILE project as well since these exist only while the debuggee is alive and running.

Labels: ,

Saturday, June 04, 2011

DILE tutorial, part 4: Information, Debug Output and Log Message Panel

The time has come to start to talk about debugging a little bit.

In the bottom of the main window of DILE several panels can be found. The leftmost panel is the Information Panel.
Basically DILE uses this panel for logging. You will see several lines here when an assembly is loaded and you can see error messages here as well if something went wrong. It's worth taking a look at this panel every once in a while especially if something unexpected happens.

The second panel which is called Debug Output Panel is lot more exciting.
I don't want to go into too much detail but roughly debugging works the following way. The Debugger API defines a set of interfaces (like ICorDebugManagedCallback) that debuggers have to implement. When debugging starts debuggers have to create an instance of their own implementation and give that to the Debugger API. Later during the debugging process the API will call methods on this object and this is communication between the API and the debugger is solved.

In the Debug Output Panel DILE displays what calls it receives from the underlying Debugger API exactly. So here you can see messages corresponding to the different events like an assembly was loaded, a code step command was completed or a thread was created. When an event is clicked in the left-side then all corresponding details will be displayed in the right-side of the panel.
This panel is not the most useful one but it can definitely be interesting. :-)

The third panel will be familiar I think. This is the place where debug messages sent by debugge processes are displayed.

That's it for now. Next time I'll continue explaining the remaining panels and the reason why DILE needs so many loaded assemblies for debugging.

Labels: ,

Monday, May 09, 2011

DILE tutorial, part 3: Quick Search and Start Page

This time I'll talk about 2 different parts of the UI. The first one is the Quick Search panel. This panel can be found next to the Project Explorer and it helps with searching for different kind of disassembled items. Let's use the Dile.exe and Dile.Debug.dll files once again for this tutorial.

The idea is not new. There is a text box in the top of the panel where full or partial name of items can be entered and DILE will list all disassembled objects that match the entered text. The searching algorithm is quite simple as it just simply looks for items where the name contains the entered text (so regular expressions are not supported although if somebody really needs it...). Names are case-sensitive so make sure you write your search term with proper casing. Searching is done on a separate thread so it can be stopped anytime by pressing the Escape key. Matched items will appear continuously as this searching thread finds them.

By default only Type Definitions will be displayed but this can be easily changed by clicking on the "..." button next to the text box which will bring up the following window:

Here the searched members can be configured differently for all assemblies. Usually searching for Method Definitions and Properties can be quite useful.

Obviously, searching for items wouldn't be very useful if we couldn't open them. So just right-click on any found item and the following context menu will be displayed:

These are the options:
  • Display item: the disassembled code of the selected item will be displayed in a text panel on the left side.
  • Locate in Project Explorer: the Project Explorer will be brought forward and the selected item will be shown in it. All necessary parent nodes will be expanded to be able to navigate to the item.
  • Copy to clipboard: the name, type or both of the selected item will be copied to the clipboard.
  • Display text...: the name, type or both of the selected item will be displayed in the Text Viewer window.
The Quick Search tool can be really handy when assemblies contain lots of items and navigating the Project Explorer becomes a bit confusing. So spend some time on learning how to use it, it can save lot of time for you in the future. :-)

The second part of the UI that I wanted to talk about is the Start Page. This is the panel that occupies most of the window when DILE starts.
I'm sure this will be familiar as well. The page contains 6 sections:

  • Recent Projects: by default, the last 10 DILE projects that were opened are listed here.
  • Recent Assemblies: by default, the last 10 assemblies that were opened are listed here.
  • Recent Memory Dump Files: by default, the last 10 memory dump files that were opened are listed here.
  • Project News: SourceForge RSS feed that contains news about the DILE project (rarely updated).
  • Latest Releases: SourceForge RSS feed about the latest DILE releases. You can check here whether there is any new version that can be downloaded.
  • Blog: RSS feed of this blog.
For the last 3 sections (RSS feeds) DILE simply sends web requests to get the content of the RSS feeds, then formats the retrieved XML using XSLT and displays them in 3 separate web controls. This is a quite simple and easy solution however it has a few problems. The smaller problem is that since web controls are used they allow you to navigate to other pages within DILE which is quite weird. But the bigger problem is that web controls don't really support drag&drop operations. The best I could achieve is hijacking the drop operation and getting 1 file name from the list of dropped files. Therefore if you want to open more than one assemblies by dropping them on DILE then please try to avoid the web control areas. I think in the future I'll replace these web controls with custom controls just to solve this drag&drop issue.

Ok, that's all for now. I hope I've managed to tell a few tricks again. :-)

Labels: ,

Sunday, May 01, 2011

DILE tutorial, part 2: Project Explorer

Let's start to dissect the UI of DILE. One of the most important parts is definitely the Project Explorer. This is the place where all loaded assemblies can be viewed and their contents can be browsed.

When DILE is started it creates a new, empty project automatically. Therefore the Project Explorer is empty first:

Right-click on the "New project" node and a simple context menu will be displayed:

The options are:
  • Add assembly...: This option will open the usual Windows Open File Dialog where one or more assemblies can be selected. Obviously, DILE will load all the selected assemblies and their content will be displayed in the Project Explorer (see later).
  • Reload all assemblies: DILE does not hold lock on any loaded assembly therefore it's safe to add the output assembly of your Visual Studio project. Whenever you make changes and recompile your assembly, just choose this option to reload all the assemblies which are in the Project Explorer so DILE can pick up the latest version. However, reloading assemblies will not affect currently displayed IL code. This is both kind of a bug and feature. I thought about fixing it but in some cases I found it useful that I could compare the old and new version of the IL code of an element.
  • Properties...: This option opens the project properties windows. I'll explain that window in a later post.
Ok, so once we load an assembly, it appears in the Project Explorer. Just for fun, let's load Dile.exe and Dile.Debug.dll:
I'm sure this view is familiar from other decompilers and disassemblers. You can see all loaded assemblies and their content in a nice tree view. There are special nodes with the name "definition" which allow you to open the definition of the parent node. So for example, the first "definition" node in the screenshot above can be used to open the assembly definition. While the second is for opening the definition of the module. Roughly, the tree structure is something like this:
  • Project
    • Assembly
      • Exported Types: types that are forwarded using the TypeForwardedTo attribute.
      • Manifest Resources
      • Module References: unmanaged module references.
      • References: assembly references.
      • Files: referenced files
      • Namespaces: all namespaces of the assembly are listed here. Often, there is a special namespace called: <no namespace>. In some cases compilers generate classes without any namespace and all those classes will be listed here.
        • Types: all types that belong to the parent namespace will be listed here.
          • Events: events of the type, if there are any.
            • Add/remove methods of the parent event.
          • Fields: fields of the type, if there are any.
          • Methods: methods of the type, if there are any.
          • Properties: properties of the type, if there are any.
            • Get/set/let/other methods of the parent property.
In general, leaf nodes can be double-clicked and related disassembled code will be displayed in a text viewer. For example, double clicking the get() method of a property will display the IL code associated with that method.

A few of the nodes also have quite important associated context menus. Right-clicking on an assembly will bring up the following menu:
The options are:
  • Full path of the assembly: Clicking it won't do anything, it's displayed only as information.
  • Copy path to clipboard
  • Display path...: The full path will be displayed in the Text Viewer window. I'll talk about this window later.
  • Set as startup assembly: This option marks the assembly as the startup assembly and enables debugging. Startup assemblies are marked with a red color and italic font-style. I'll explain debugging in another blog post, it's quite a big subject.
  • Reload assembly: This option allows reloading only the selected assembly.
  • Remove assembly: Removes the assembly from the project (and the Project Explorer as well, of course).
A special context menu is available for assembly references as well:
Options:
  • Full path of the referenced assembly: The full path is determined during assembly loading and not during debugging therefore the path might be incorrect (for example, an AppDomain.AssemblyResolve event handler can easily return a different assembly during runtime). Again, clicking this option does not do anything.
  • Copy path to clipboard
  • Display path...: Displays the full path of the referenced assembly in the Text Viewer window.
  • Open reference in project: Loads the referenced assembly using the determined full path and adds it to the project (and thus to the Project Explorer).
I think that's all I can tell about the Project Explorer. Hopefully I have managed to show a few new options and/or explain how some of them really work. If you have any questions, just let me know. :-)

Labels: ,

Wednesday, March 07, 2007

DILE tutorial: basics

Link to the tutorial (3.8 MB!)

Finally, I have finished the first tutorial for DILE. It just shows some basic features of DILE and should be enough to get you started with it.
Basically, the animation shows how to debug a newly created, very simple application (which just adds two numbers). It demonstrates how to start the application in DILE, how to step through the code, check the call stack, loaded modules, local variables/arguments, evaluate expressions and how to use the Object Viewer. There are lots of explaining messages that will - hopefully - make clear why some things work differently in DILE.

Please, let me know of what you think of this tutorial, whether it's really useful, whether I should make more and if yes, then I'd be glad to hear ideas on what should the following ones be about (I have a few more subjects on my mind though). Of course, I'd also like to hear if you think that I should do something differently in such tutorials. And - as always - if you have anything else to say about DILE then just send me an e-mail or leave a comment. :-)

One more thing, if you are planning to link to the tutorial (why would anyone do that though?), then please link to this blog entry. Sooner or later (but rather later...) I will create a homepage for DILE and then I will move the tutorials there also and I'll update the link to it in this post. Thanks!

P.S.: As Sebastian suggested, I have used Wink for creating this Flash animation.

Labels: ,