DILE tutorial, part 4: Information, Debug Output and Log Message Panel
The time has come to start to talk about debugging a little bit.
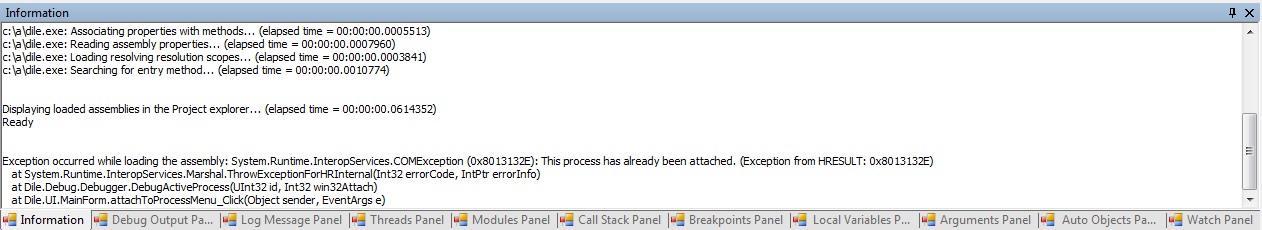
In the bottom of the main window of DILE several panels can be found. The leftmost panel is the Information Panel.
 Basically DILE uses this panel for logging. You will see several lines here when an assembly is loaded and you can see error messages here as well if something went wrong. It's worth taking a look at this panel every once in a while especially if something unexpected happens.
The second panel which is called Debug Output Panel is lot more exciting.
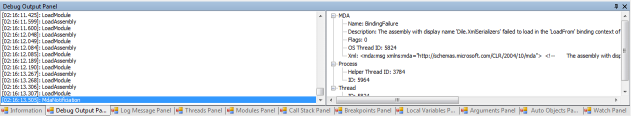 I don't want to go into too much detail but roughly debugging works the following way. The Debugger API defines a set of interfaces (like ICorDebugManagedCallback) that debuggers have to implement. When debugging starts debuggers have to create an instance of their own implementation and give that to the Debugger API. Later during the debugging process the API will call methods on this object and this is communication between the API and the debugger is solved.
In the Debug Output Panel DILE displays what calls it receives from the underlying Debugger API exactly. So here you can see messages corresponding to the different events like an assembly was loaded, a code step command was completed or a thread was created. When an event is clicked in the left-side then all corresponding details will be displayed in the right-side of the panel.
This panel is not the most useful one but it can definitely be interesting. :-)
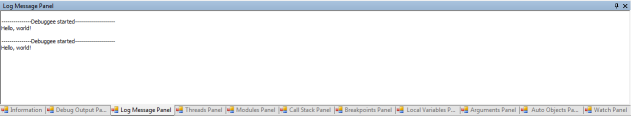
The third panel will be familiar I think. This is the place where debug messages sent by debugge processes are displayed.
That's it for now. Next time I'll continue explaining the remaining panels and the reason why DILE needs so many loaded assemblies for debugging.
In the bottom of the main window of DILE several panels can be found. The leftmost panel is the Information Panel.
The second panel which is called Debug Output Panel is lot more exciting.

In the Debug Output Panel DILE displays what calls it receives from the underlying Debugger API exactly. So here you can see messages corresponding to the different events like an assembly was loaded, a code step command was completed or a thread was created. When an event is clicked in the left-side then all corresponding details will be displayed in the right-side of the panel.
This panel is not the most useful one but it can definitely be interesting. :-)
The third panel will be familiar I think. This is the place where debug messages sent by debugge processes are displayed.

That's it for now. Next time I'll continue explaining the remaining panels and the reason why DILE needs so many loaded assemblies for debugging.
posted by Zsozso at 6/04/2011 05:58:00 PM
0 comments
![]()
![]()


