DILE tutorial, part 1: Main Window
As I promised in my previous post, I'll try to spend the next few weeks on writing a little bit about the user interface of DILE. Hopefully this will be useful for many people.
Let's start with the main window. Once Dile.exe is started, the following screen appears:
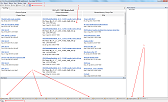
The numbers are pointing at the following important areas:
1. Main menu. Just the usual stuff. In a later post I'll explain the most interesting options like Settings.
2. Toolbar. Most buttons in the toolbar are enabled only during debugging. From left to right:
- Run: Starts or resumes the debuggee.
- Pause: Pauses the debuggee if it's currently running.
- Stop: Stops the debuggee (which means killing the debuggee process).
- Detach: Detaches from the debuggee (which means leaving the debuggee process running).
- Ignore exception: This button is enabled when the debuggee is paused at an exception. Using this button DILE can be instructed to ignore all similar exceptions in the future, no matter where they are thrown.
- Ignore exception at the current location: This is one of my favorite features in DILE. I wish all debuggers had it. This button is also enabled only when the debuggee is paused at an exception. However, pressing this button means that DILE will ignore exceptions thrown only at the current address. For example, if you know that a FileNotFoundException will be thrown every time your application starts because you don't use XML Serializer assemblies then you can press this button when Reflection throws this exception. However, if a FileNotFoundException is thrown anywhere else (let's say by a File.Open call) then DILE will still pause the debugge. This gives you a much finer control over which exceptions you're interested in.
- Decimal/hexadecimal format: This button changes the way DILE displays numbers.
3. Start Page: The idea should be familiar from Visual Studio. The page contains the following 6 areas:
- Recent Projects: List of recently opened projects (.dileproj files). By default, maximum the last 10 projects will be remembered.
- Recent Assemblies: List of recently opened assemblies. Again, maximum the last 10 assemblies will be displayed here by default.
- Recent Memory Dump Files: List of recently opened memory dump files (.dmp). The default limit is 10 here as well.
- Project News: Latest DILE related project news from Sourceforge.
- Latest Releases: List of latest DILE releases that I upload to Sourceforge. You will see all new weekly builds here.
- Blog: Latest entries in my blog.
The last 3 parts are displayed by web browser controls so drag&dropping on them doesn't work very well. If you want to open projects, assemblies or dump files by dragging & dropping them on DILE then please try to avoid these 3 areas. In the future I'll try to replace these web controls to solve this issue.
4. Panels: There are lots of panels and most of them are active only during debugging. I'll write more about them in a later post but here is a brief description of each of them. From left to right:
- Information: Basically this panel is used by DILE for logging. Every time you load assemblies DILE will log here the process. And of course, if any error occurs in DILE then those will be logged here as well. Please, do send me such logs if you come across any error.
- Debug Output Panel: Events raised by the underlying debugging API (ICorDebug) will be added here. Although in most cases they are rather interesting than useful.
- Log Message Panel: The debugge's debug messages will be collected here. If you call System.Diagnostics.Debug.Write() or anything similar in your code then expect the output to appear in this panel.
- Threads Panel: List of threads in the debuggee process.
- Modules Panel: List of modules loaded by the debuggee process.
- Call Stack Panel: The current call stack of the active thread.
- Breakpoints Panel: List of breakpoints that were set in the IL code.
- Local Variables Panel: List of the currently active method's local variables.
- Arguments Panel: List of the currently active method's arguments.
- Auto Objects Panel: Currently this panel is only used for displaying the active exception (if there is any).
- Watch Panel: User specified expressions that will be evaluated every time the debuggee is paused.
5. Project related stuff.
- Project explorer: Lists all the loaded assemblies and allows browsing their content. You will find all information about assemblies here like types, methods, properties and so on.
- Quick Search: Allows users to search types, methods, properties, fields, events, etc. The idea is not new. Just start to type and DILE will filter the list of items for you.
6. Status bar: You can see messages from DILE here similarly to the Information panel.
These are the most important areas of the DILE main window. As I mentioned earlier, in future posts I'll explain all of them in more details and I'll explain how I use them.
And of course, if there's anything specific that you would like to hear about then please let me know.
posted by Zsozso at 4/23/2011 07:32:00 PM
![]()
![]()


0 Comments:
Post a Comment
<< Home