DILE feature: loading modules from memory dump files
One of the main reasons why I started to work on dump-debugging support for DILE is that I thought I could add a little twist to it once again.
The problem
If you're using VS2010 for analyzing a dump file then you'll run into a quite serious problem very quickly: if VS can't find the original source code and pdb file of the modules then it will show you only the disassembled x86 code. This can really make life difficult as it's quite difficult to map back those x86 instructions to your actual code to figure out which line caused a problem etc.
The solution
DILE has had a very interesting feature for ages: it can load dynamically generated assemblies from the memory of a debuggee process. What this means is that if your application generates assemblies on-the-fly via Reflection.Emit (compiled RegExes do the same or the XSLT compiler if an XSLT file contains C# code) then DILE can load that assembly and treat it as any other assembly even if it's never saved on the hard disk. And of course, all the usual features like breakpoints, stepping etc also work with such dynamic assemblies.
So obviously I wanted to do the same with dump files since they usually contain the full memory of the debuggee, including loaded modules. Fortunately it was quite easy to modify the code to load modules from the memory of the debuggee process (i.e. from the dump file) instead of looking for them on the hard disk. Although fixing the UI wasn't trivial but that's a long story. :-)
Usage
If you download the latest weekly build of DILE and load a dump file in it then you will notice that there's a new menu item in all context menus related to modules: "Add module to project from memory dump". If you click on this option then DILE will read the module from the dump file and not from your local hard drive.
Why is this cool?
As a result you don't have to worry anymore about what version of your application crashed when you created the dump file, you don't have to know what patches were applied on your application/3rd party components/.NET Framework and most importantly you don't have to have exactly the same version of all components on your machine when you're dump debugging. DILE will show you the state of your application _exactly_ as it was when the dump file was created. And that makes finding bugs a lot easier. :-)
Update:
The Screenshots
Alex suggested in the comments section adding screenshots to this post which is definitely a good idea. I used to upload files to FreeWebTown but let's say... I'm not really satisfied with them. They simply deleted my account without any warning so all the files that I had there are lost. Unfortunately I don't have backups as well because over the years I had a few unplanned hard disk crashes etc.
Anyway... I've realized that I can also upload files to SourceForge. I trust them more. :-)
So, the screenshots:
 |  |
Opening a memory dump file | Loading module from the memory dump file in the Modules Panel |
 | 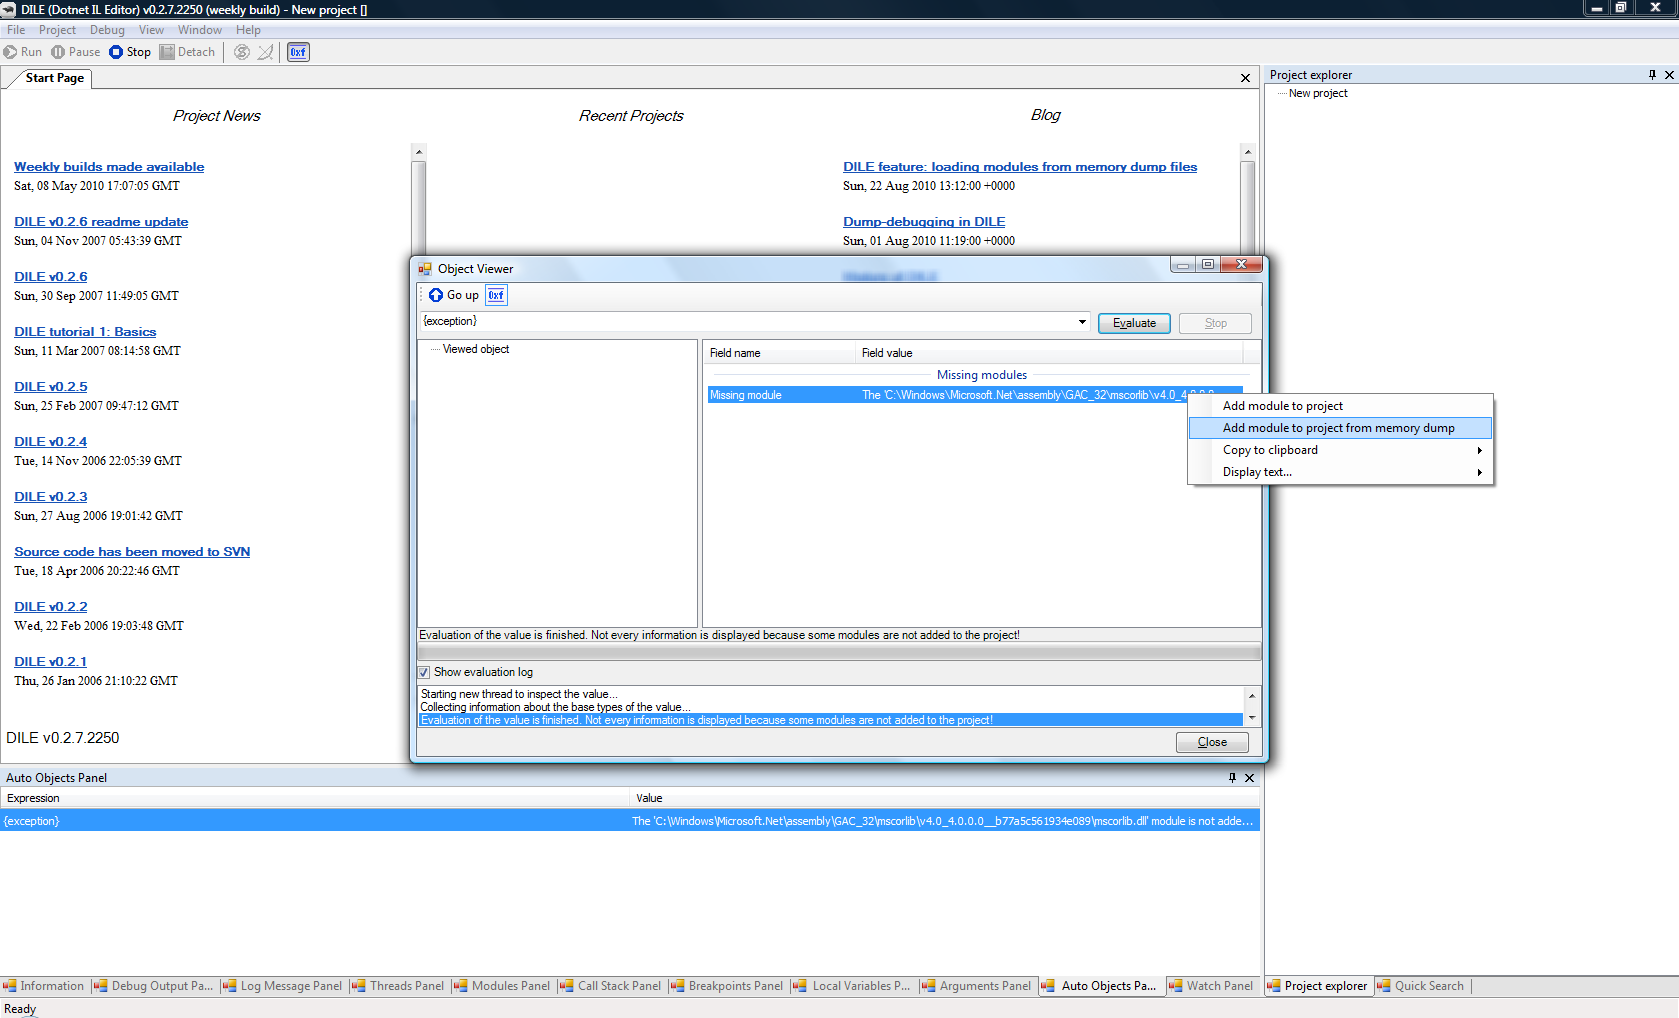 |
Loading module from the memory dump file in the Call Stack Panel | Loading module from the memory dump file in the Object Viewer |
Labels: DILE, dump debugging, weekly build
posted by Zsozso at 8/22/2010 03:12:00 PM
![]()
![]()


8 Comments:
I THINK I like where you're going with this, but without knowing anything about DILE, I don't fully understand what you're trying to explain. I think this post would be better if you created some screenshots to illustrate the concept. Would also be useful if you provided some code to show how it's all done.
Hi Alex,
You're absolutely right and I'm sorry for publishing such a confusing post.
Actually I used to upload files (screenshots etc) to www.freewebtown.com but... one day all my links were redirected to their website. And when I complained about this (http://www.freewebtown.com/community/mb_topics_view.php?id=4&cnt=1964&name=Computing&reply=2999) they first deleted my thread and then my account as well. This is the reason why all my images and links are broken in my blog.
Anyway, I'll look for another hosting service in the weekend and start to upload screenshots again.
And please let me know if you can suggest me a good provider where I can upload any kind of files (including binary files).
Thanks a lot for your feedback.
Regards,
Zsolt Petreny
I use Windows Live Writer for my blog posts on www.alexdresko.com and inserting images into my posts is a simple master of pasting them where I want them. Somehow it takes care of storing them on my site for me. I'm pretty sure blogger.com supports this feature as well. As for binary data, I'd suggest something like box.net, personally. Or, if you were to host your own blog on your own domain, you could host and link to the files directly on your server. For the record, my host is mediatemple.net and I'm extremely happy with them!
Hi Alex,
I have added screenshots, I hope they make my post a bit more clear. :-)
Actually, I don't have my own domain or server, I've never received any money for DILE so I try not to spend on it as well. Except my time, of course...
Anyway, I looked around the web and I found a very nice web host provider: http://x10hosting.com/
But then I realized that I can use simply SourceForge for storing my files. But if I need any other service in the future, I'll definitely consider using them.
Anyway, thanks for the feedback and helping me. :-)
Regards,
Zsolt Petreny
Great tool. Memory dump would be an absolutely fantastic feature. The ability to see the stack frame as you debug would also be a great addition. Either way, this is by far the best IL disassembler out there. I tried your nightly build but unfortunately it kept failing as i tried to start debugging. Can't wait for a stable release! Keep up the good work!!
Hi Sergey,
I'm glad to hear that you like DILE. :)
May I ask what was wrong with the nightly build? If you could send me a description of what happened (an error message maybe or you could debug DILE with DILE to get a nice stack trace ;)) then I'll fix that problem.
You can either post it here as a comment or send me an e-mail to "dile dot project at gmail dot com".
Thanks in advance. :)
Hi Zsolt,
I am new to DILE and really like it so far. I've been trying to figure it out myself but it is beyond my skill-set. Is there a tutorial or "getting started" guide I can read? I am trying to use DILE to retrieve variables in an application when it crashes. I can attach to the process, get the IL but then the process fails and I can't see the values in the variables.
Hi Ademus Prime,
I created a tutorial a long time ago but thanks to a number of hard disk failures and my not-so-nice web site hosting provider, I don't have any copy of it anymore. :-(
However, interestingly I did find a tutorial a few months ago that shows how to hack a game (I wouldn't say I'm happy about it). Take a look at it, maybe you can learn something from it:
http://pzsolt.blogspot.com/2010/03/dile-tutorial-from-hacker.html
Anyway, I'll try to help with viewing variables. You have several options that all lead to the same place:
- You can open the Object Viewer (Debug -> Object viewer in the menu) which is very similar to the Quick Watch window in Visual Studio.
- You can go to the Local Variables panel where all variables of the current method will be displayed. Double-clicking a variable will open the Object Viewer window and show the value of the selected variable.
- You can go to the Arguments panel where you can see the value of arguments of the current method. Double-clicking works here similarly to the Local Variables panel.
- You can go to the Auto Objects panel to see what the current exception is if there is any. Don't forget to double-click on it. :-)
- You can go to the Watch panel where you can enter expressions and those will be evaluated after every step command. Again, double-clicking works here as well.
In the Object Viewer you can access all arguments with "A_" prefix and the ordinal of the argument (A_0 is the "this" parameter in case of instance methods) and all local variables with "V_" prefix and the ordinal of the variable. When you write expressions here please make sure that you always write the fully qualified name of types and that the assembly which contains the definition of the type is loaded into DILE. E.g.: System.Environment.Version.ToString() or V_1.ToString().
One more thing: if you see an "xyz module is not added to the project" error then you can always right-click on it and choose "Add module to project" to quickly get it loaded in DILE. Once the module is loaded, just repeat the expression evaluation.
Oh, and you can also play with the Call Stack panel. Just double-click any line in the Call Stack panel and DILE will display the selected method's local variables and arguments in the respective panels.
That's all I can think of suddenly. If you have any specific question then let me know and I'll try to answer it. And I think I'll also create a tutorial soon now that there's demand for it...
Thanks for using DILE. :-)
Regards,
Zsolt Petreny
Post a Comment
<< Home