DILE tutorial, part 3: Quick Search and Start Page
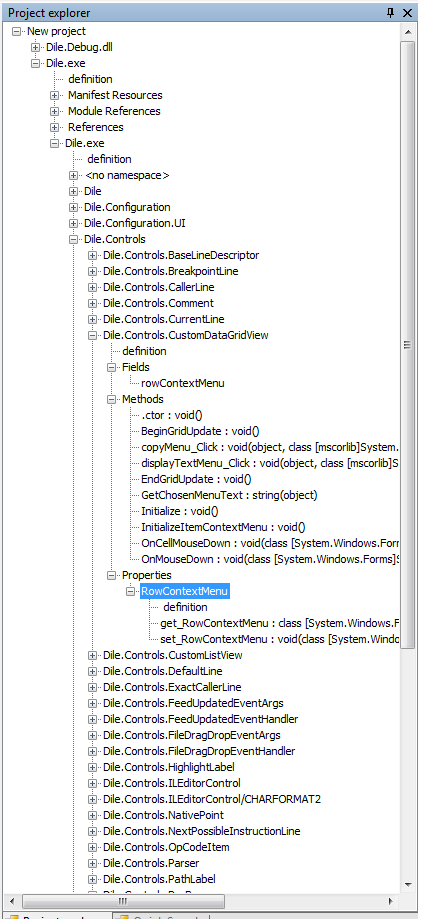
This time I'll talk about 2 different parts of the UI. The first one is the Quick Search panel. This panel can be found next to the Project Explorer and it helps with searching for different kind of disassembled items. Let's use the Dile.exe and Dile.Debug.dll files once again for this tutorial.
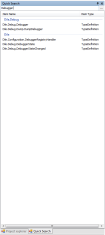 The idea is not new. There is a text box in the top of the panel where full or partial name of items can be entered and DILE will list all disassembled objects that match the entered text. The searching algorithm is quite simple as it just simply looks for items where the name contains the entered text (so regular expressions are not supported although if somebody really needs it...). Names are case-sensitive so make sure you write your search term with proper casing. Searching is done on a separate thread so it can be stopped anytime by pressing the Escape key. Matched items will appear continuously as this searching thread finds them.
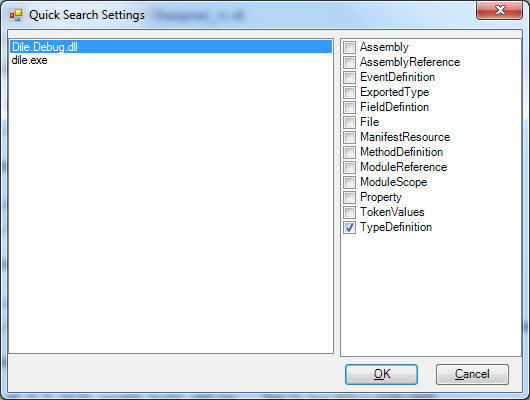
By default only Type Definitions will be displayed but this can be easily changed by clicking on the "..." button next to the text box which will bring up the following window:
 Here the searched members can be configured differently for all assemblies. Usually searching for Method Definitions and Properties can be quite useful.
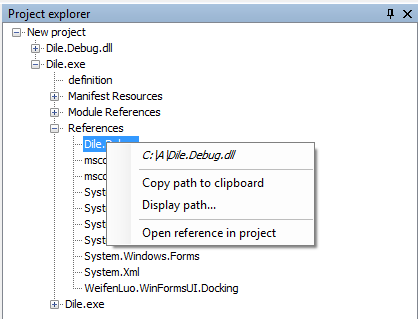
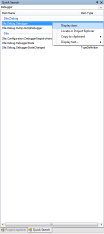
Obviously, searching for items wouldn't be very useful if we couldn't open them. So just right-click on any found item and the following context menu will be displayed:
 These are the options:


By default only Type Definitions will be displayed but this can be easily changed by clicking on the "..." button next to the text box which will bring up the following window:
Obviously, searching for items wouldn't be very useful if we couldn't open them. So just right-click on any found item and the following context menu will be displayed:

- Display item: the disassembled code of the selected item will be displayed in a text panel on the left side.
- Locate in Project Explorer: the Project Explorer will be brought forward and the selected item will be shown in it. All necessary parent nodes will be expanded to be able to navigate to the item.
- Copy to clipboard: the name, type or both of the selected item will be copied to the clipboard.
- Display text...: the name, type or both of the selected item will be displayed in the Text Viewer window.
The Quick Search tool can be really handy when assemblies contain lots of items and navigating the Project Explorer becomes a bit confusing. So spend some time on learning how to use it, it can save lot of time for you in the future. :-)
The second part of the UI that I wanted to talk about is the Start Page. This is the panel that occupies most of the window when DILE starts.

I'm sure this will be familiar as well. The page contains 6 sections:
- Recent Projects: by default, the last 10 DILE projects that were opened are listed here.
- Recent Assemblies: by default, the last 10 assemblies that were opened are listed here.
- Recent Memory Dump Files: by default, the last 10 memory dump files that were opened are listed here.
- Project News: SourceForge RSS feed that contains news about the DILE project (rarely updated).
- Latest Releases: SourceForge RSS feed about the latest DILE releases. You can check here whether there is any new version that can be downloaded.
- Blog: RSS feed of this blog.
For the last 3 sections (RSS feeds) DILE simply sends web requests to get the content of the RSS feeds, then formats the retrieved XML using XSLT and displays them in 3 separate web controls. This is a quite simple and easy solution however it has a few problems. The smaller problem is that since web controls are used they allow you to navigate to other pages within DILE which is quite weird. But the bigger problem is that web controls don't really support drag&drop operations. The best I could achieve is hijacking the drop operation and getting 1 file name from the list of dropped files. Therefore if you want to open more than one assemblies by dropping them on DILE then please try to avoid the web control areas. I think in the future I'll replace these web controls with custom controls just to solve this drag&drop issue.
Ok, that's all for now. I hope I've managed to tell a few tricks again. :-)
posted by Zsozso at 5/09/2011 03:58:00 AM
2 comments
![]()
![]()