DILE feature: loading modules from memory dump files
One of the main reasons why I started to work on dump-debugging support for DILE is that I thought I could add a little twist to it once again.
The problem
If you're using VS2010 for analyzing a dump file then you'll run into a quite serious problem very quickly: if VS can't find the original source code and pdb file of the modules then it will show you only the disassembled x86 code. This can really make life difficult as it's quite difficult to map back those x86 instructions to your actual code to figure out which line caused a problem etc.
The solution
DILE has had a very interesting feature for ages: it can load dynamically generated assemblies from the memory of a debuggee process. What this means is that if your application generates assemblies on-the-fly via Reflection.Emit (compiled RegExes do the same or the XSLT compiler if an XSLT file contains C# code) then DILE can load that assembly and treat it as any other assembly even if it's never saved on the hard disk. And of course, all the usual features like breakpoints, stepping etc also work with such dynamic assemblies.
So obviously I wanted to do the same with dump files since they usually contain the full memory of the debuggee, including loaded modules. Fortunately it was quite easy to modify the code to load modules from the memory of the debuggee process (i.e. from the dump file) instead of looking for them on the hard disk. Although fixing the UI wasn't trivial but that's a long story. :-)
Usage
If you download the latest weekly build of DILE and load a dump file in it then you will notice that there's a new menu item in all context menus related to modules: "Add module to project from memory dump". If you click on this option then DILE will read the module from the dump file and not from your local hard drive.
Why is this cool?
As a result you don't have to worry anymore about what version of your application crashed when you created the dump file, you don't have to know what patches were applied on your application/3rd party components/.NET Framework and most importantly you don't have to have exactly the same version of all components on your machine when you're dump debugging. DILE will show you the state of your application _exactly_ as it was when the dump file was created. And that makes finding bugs a lot easier. :-)
Update:
The Screenshots
Alex suggested in the comments section adding screenshots to this post which is definitely a good idea. I used to upload files to FreeWebTown but let's say... I'm not really satisfied with them. They simply deleted my account without any warning so all the files that I had there are lost. Unfortunately I don't have backups as well because over the years I had a few unplanned hard disk crashes etc.
Anyway... I've realized that I can also upload files to SourceForge. I trust them more. :-)
So, the screenshots:
 |  |
Opening a memory dump file | Loading module from the memory dump file in the Modules Panel |
 | 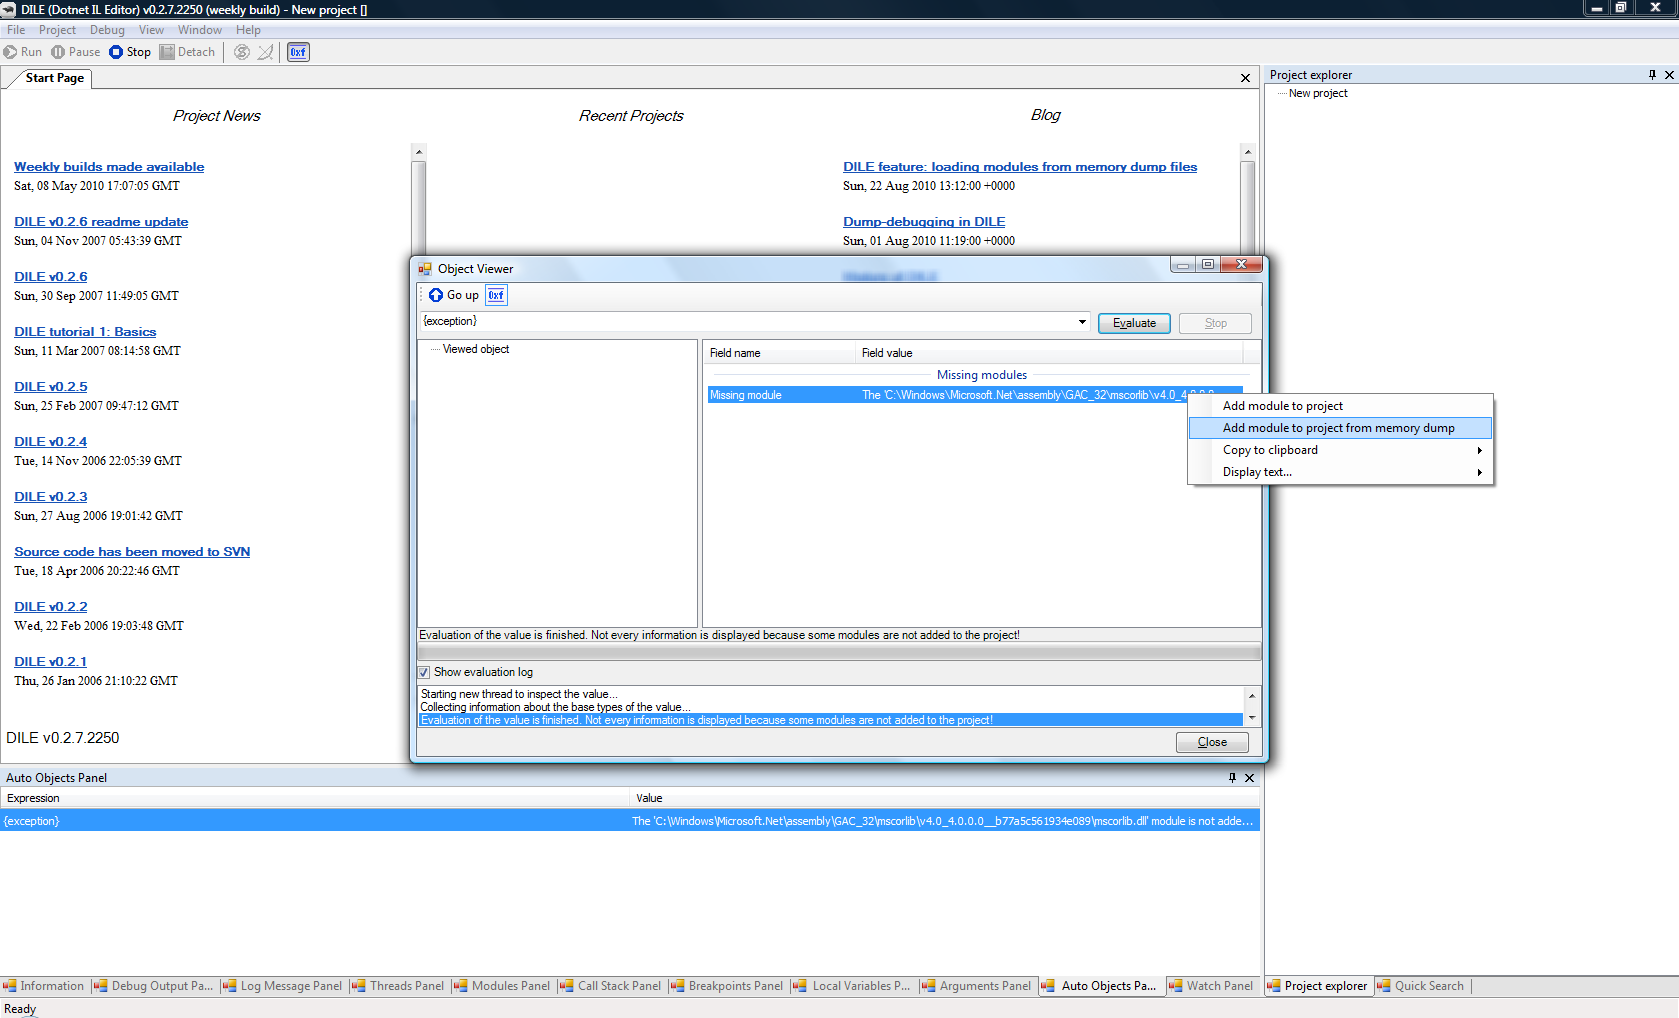 |
Loading module from the memory dump file in the Call Stack Panel | Loading module from the memory dump file in the Object Viewer |
Labels: DILE, dump debugging, weekly build
posted by Zsozso at 8/22/2010 03:12:00 PM
8 comments
![]()
![]()


